Nine monitor types
HTTP/HTTPS, keyword, TCP port, TLS certificate expiry, ICMP ping, heartbeat (cron/job), DNS records, domain expiry and SMTP checks — one tool for every endpoint you run.
From the first check to the monthly SLA report, WatchControl brings website, API and server monitoring together — full visibility over everything you run, in one place.
Nine monitor types, multi-channel alerts, status pages and reports — in one account, with no per-feature upsells.
HTTP/HTTPS, keyword, TCP port, TLS certificate expiry, ICMP ping, heartbeat (cron/job), DNS records, domain expiry and SMTP checks — one tool for every endpoint you run.
Get notified by email, webhook and SMS the moment a monitor goes down — and again when it recovers. Set re-notify intervals so nothing slips through.
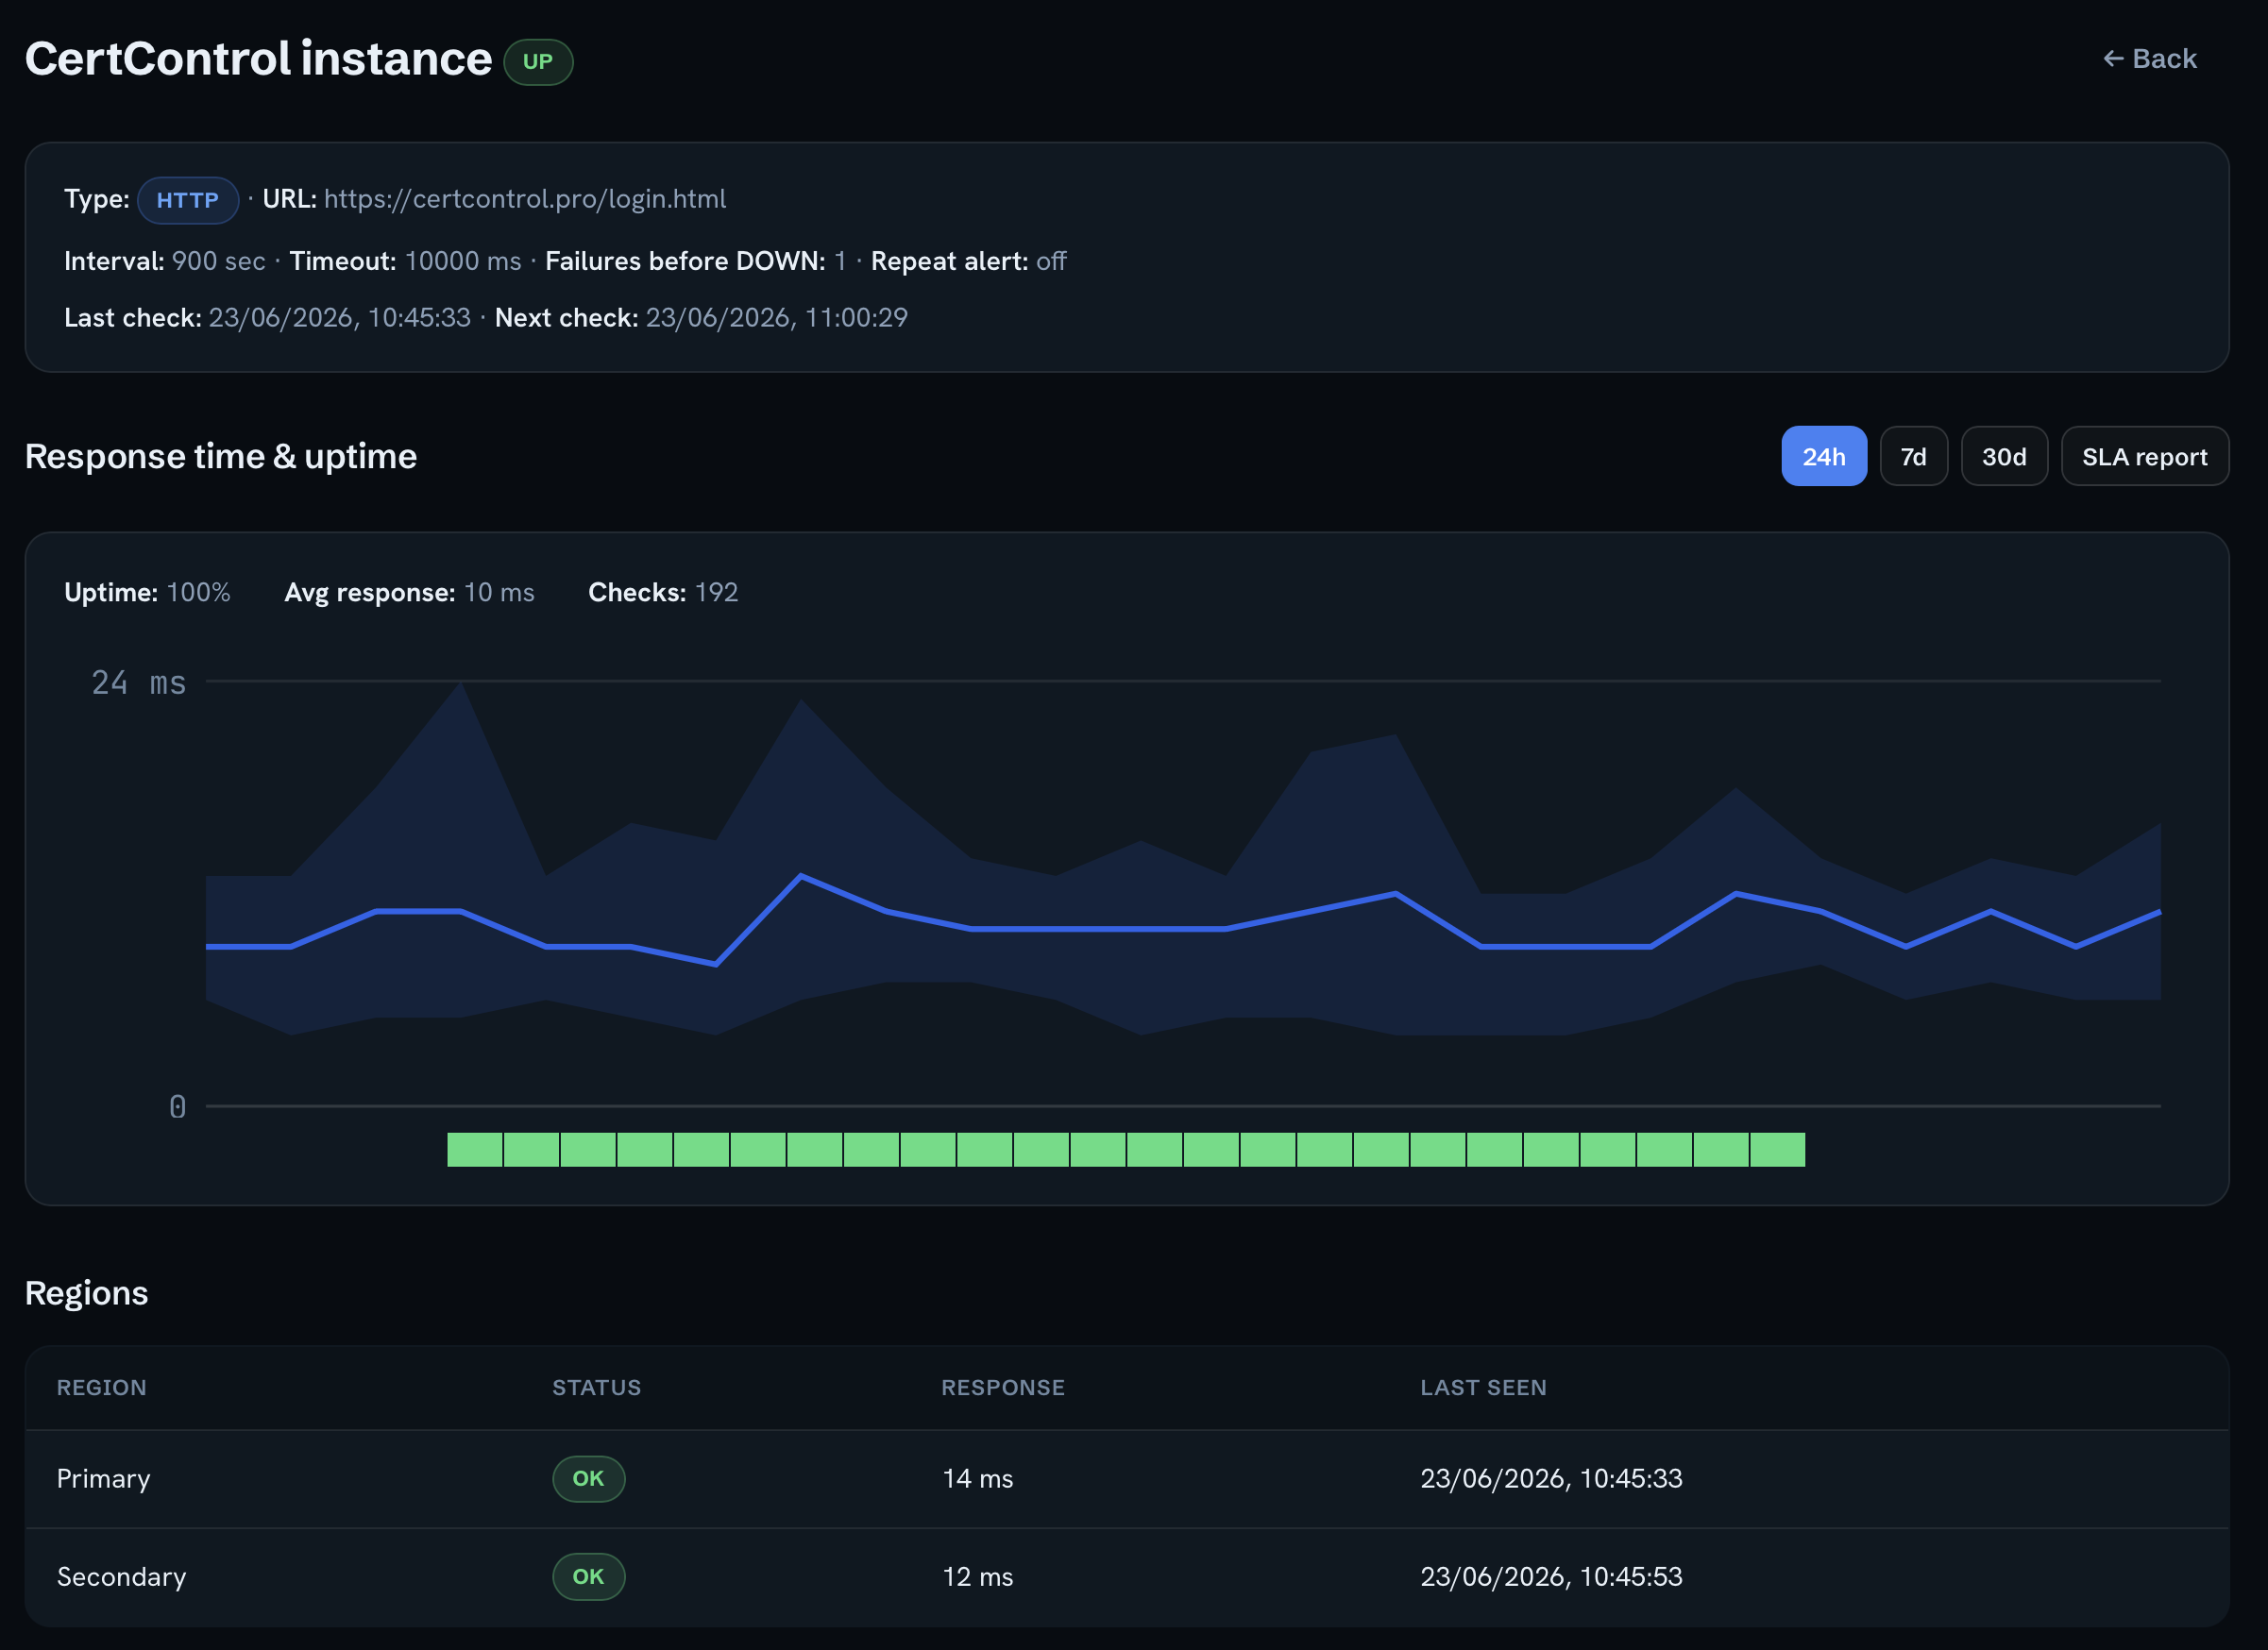
Every check records latency and status. See trends over hours or weeks, and get alerted when a service turns slow — not only when it dies.
Share a branded status page with your customers. Post incidents and live updates, and show real uptime instead of answering “is it down?” emails.
Set an uptime target per monitor and get a clean monthly SLA report with the exact percentage — ready to print or export as PDF.
Catch TLS certificates before they expire and verify a page still contains — or no longer contains — the text it should. JSON and expected-status assertions included.
Invite your team into organisations with admin and viewer roles. Every change is recorded in an activity log you can review at any time.
Automate everything with API keys and a REST API. Trigger webhooks on state changes, schedule maintenance windows and build escalation policies.
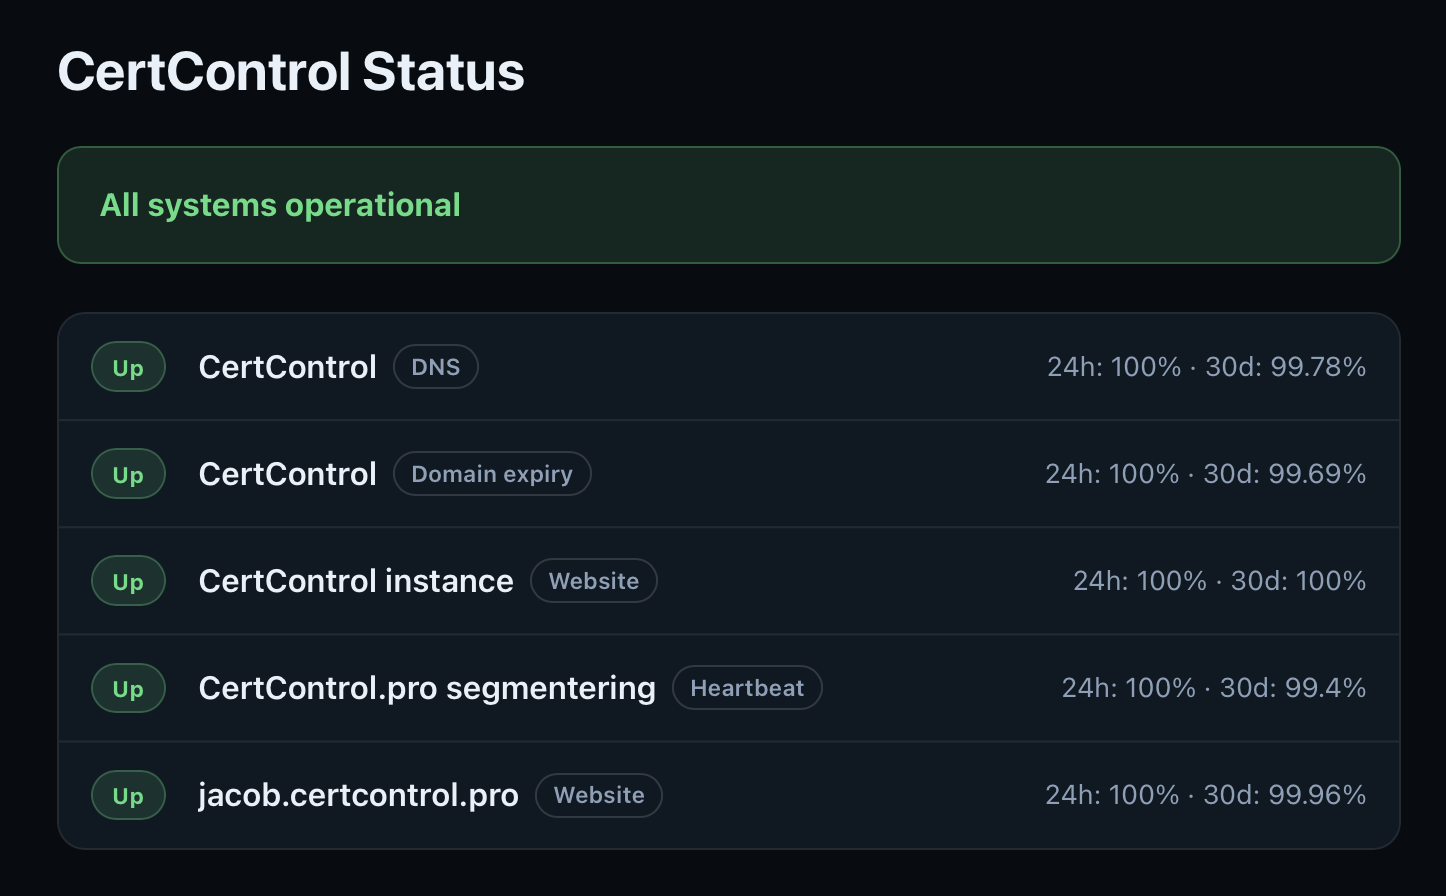
Give customers one branded page that answers “is it down?” before they ask. Group monitors by service, post incidents as they happen, and show live 24-hour and 30-day uptime for everything you run.
Paste a URL, a host and port, or grab a heartbeat link for a cron job. Pick the check type and interval — WatchControl validates the target for you.
WatchControl checks from the cloud on your schedule, records every result and confirms a failure before it alerts — so you get signal, not noise.
Email, webhook and SMS alerts the moment status changes. Share a status page and pull SLA reports whenever you need the numbers.
HTTP/HTTPS, keyword and response-time checks, as fast as every minute.
Get warned days before a TLS certificate expires.
Alerts when your A, MX or TXT records change or disappear.
Warned weeks before a domain registration lapses — incl. .dk.
A real mail-server handshake, not just an open port.
Status codes, JSON assertions, auth and response-time limits.
A Danish company that keeps your data in the EU.
Why European teams choose WatchControl.
WatchControl vs UptimeRobot, Pingdom and Site24x7.
Add your first monitor on the free plan — no credit card.